Features of the app
Home
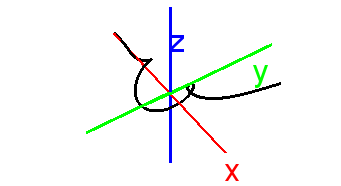
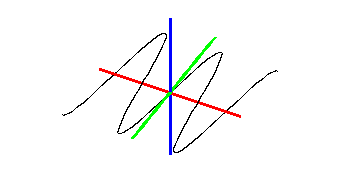
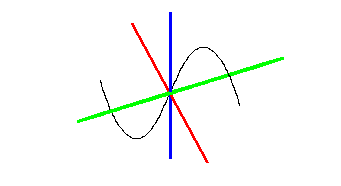
2D Function Plotting
This feature plots a 2D function of x on the 3D axes so it can be rotated and seen from all angles. If the function yields a complex value for an input, the imaginary component is plotted along the z axis. If the function is otherwise undefined at an input, no output is plotted.
Examples:
Settings:
- x start value (Default: -4)
- x stop value (Default: 4)
- Plotted points per unit (Default: 100)
- Line color (Default: black)
- Line weight (Default: 1)
- Pole detection (Default: on)
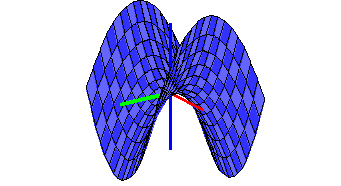
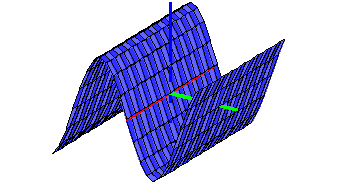
3D Function Plotting
This plots a 3D function of x and y as a surface.
Examples:
Settings:
- x start value (Default: -4)
- x stop value (Default: 4)
- y start value (Default: -4)
- y stop value (Default: 4)
- Number of polygons to draw with respect to x (Default: 32)
- Number of polygons to draw with respect to y (Default: 32)
- Mesh (Default: on)
- Surface (Default: on)
- Mesh color (Default: black)
- Mesh weight (Default: 1)
- Color style (Default: None)
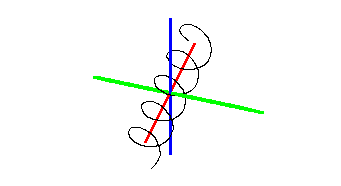
Parametric Plotting (one parameter)
This plots a parametric curve in 3D space using a single parameter. To get a 2D parametric curve, just set the z function to 0.
Examples:
Settings:
- Parameter start value (Default: -5)
- Parameter stop value (Default: 5)
- Line color (Default: black)
- Line weight (Default: 1)
- Parameter step (Default: 1/10)
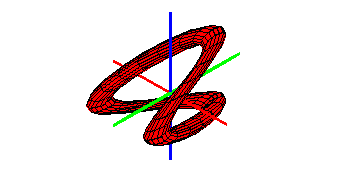
Parametric Plotting (two parameters)
This feature plots a parametric surface in 3D space using two parameters.
Examples:
Settings:
- First parameter start (Default: -5)
- First parameter stop (Default: 5)
- Second parameter start (Default: -5)
- Second parameter stop (Default: 5)
- Number of polygons to draw with respect to x (Default: 32)
- Number of polygons to draw with respect to y (Default: 32)
- Mesh color (Default: black)
- Mesh weight (Default: 1)
- Mesh (default: on)
- Surface (default: off)
- Color style: (Default: None)
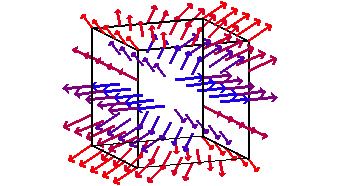
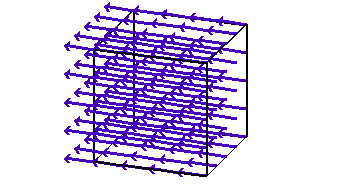
Vector Field Plotting
Plots a vector valued function as a 3D vector field.
Examples:
Settings:
- x start value (Default: -4)
- x stop value (Default: 4)
- y start value (Default: -4)
- y stop value (Default: 4)
- z start value (Default: -4)
- z stop value (Default: 4)
- Vectors per unit (Default: 1)
- Magnitude based coloring (Default: on)
- Color (Default: None)
- Cube (Default: on)
- Cube weight (Default: 2)
- Cube color: (Default: black)
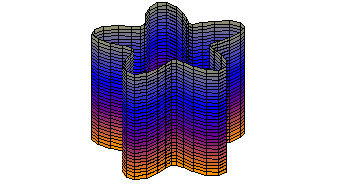
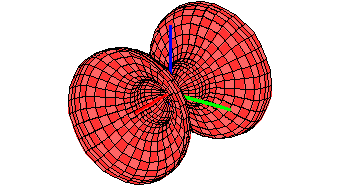
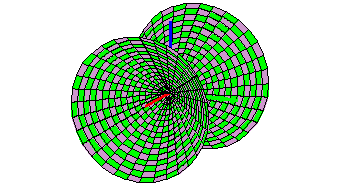
Cylindrical Function Plotting
Plots a function with cylindrical coordinates (3D generalization of polar coordinates)
Examples:
Settings:
- Theta start value (Default: -pi)
- Theta stop value (Default: pi)
- z start value (Default: -4)
- z stop value (Default: 4)
- Polygons per z-value (Default: 32)
- Number of z-values (Default: 32)
- Mesh (Default: on)
- Surface (Default: off)
- Mesh weight (Default: 1)
- Mesh color (Default: black)
- Color style (Default: None)
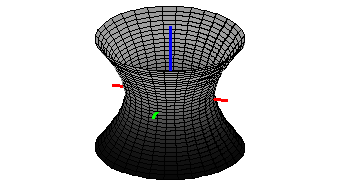
Revolution Surface Plotting
This feature plots a solid of revolution; that is, the resulting solid if a function of x is rotated about some axis.
Examples:
Settings:
- x start value (Default: -5)
- x stop value (Default: 5)
- Number of polygons with respect to x (Default: 32)
- Number of polygons with respect to y (Default: 32)
- Mesh color (Default: black)
- Mesh weight (Default: 1)
- Mesh (Default: on)
- Surface (Default: off)
- Color style (Default: None)
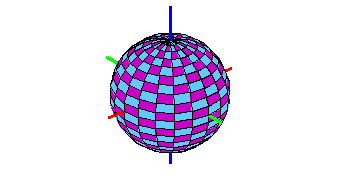
About Color Styling
Surface color styling has a lot of different options.
- Solid color - fill the entire surface with a single color.
- Checkerboard - fill the surface in a checkerboard pattern with two colors
- World Lighting - Shade based on distance from a world coordinate light source
- Screen Lighting - Shade based on distance from a fixed screen light source
- Gradient - Fill in a continuous gradient between two colors
- Value Based - Shade based on the value of a function. This option is usually used for complex functions because color serves as a fourth dimension.
- Vertical stripes - Stripes of color parallel to the y axis.
- Horizontal stripes - Stripes of color parallel to the x axis.