Just like last time, I’m going to share a few of my favorite recent graphs on Desmos. This is probably going to become a yearly thing – despite that the previous part was my first post ever, it remains the most popular. That’s probably due to the fact that r/visualizedmath on Reddit won’t let me post anymore to share my work. Anyway, on with the graphs…
November 2019 MCC Puzzler
Try it yourself: https://www.desmos.com/calculator/qsy5qk4sjv
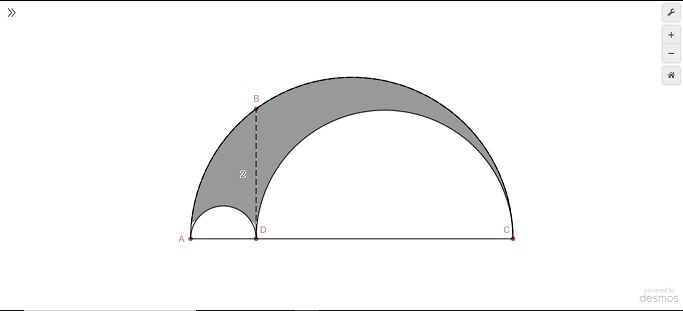
Last year, I took a couple math classes at my local community college. My linear algebra professor ran this fun little thing called the monthly puzzler. Every month, they would post a math puzzle for the MCC community to solve. November 2019’s puzzle was particularly interesting in my opinion. Consider the diagram above. Given that the two smaller semicircles are tangent, and that the dotted line has height 2, what is the area of the shaded region?
So, since I have mental issues, I spent two hours making a Desmos graph and writing up a LaTeX document with the solution. The problem is actually pretty simple, and doing what I did was way overboard. Here’s the problem statement if you want to try it out for yourself: https://sites.monroecc.edu/mathpuzzler/2019/11/01/november-2019-puzzle/. Although the problem only asks about the case where the height is two, the graph is able to calculate the shaded area for any height, represented by $y_0$.
Vector Line Integrals
Try it yourself: https://www.desmos.com/calculator/atazwbfksa

When taking multivariable calculus, Desmos (and MathGraph3D) is your friend. This graph can compute the line integral over an arbitrary parametric path on the given 2D vector field. The notation used is a little confusing because at the time I made this graph, Desmos didn’t support defining functions that output points (or maybe it did, and I didn’t realize it).
Basically, the graph allows you to define some parametric curve $\vec{r}(t), t\in \left[t_0,t_1\right]$ and a vector field $\vec{F}(x,y)$. Then, the graph will display the curve and evaluate the integral using the fact that
$$ \int_{C}\vec{F}\cdot d\vec{r} = \int_{t_0}^{t_1} \left( \vec{F}(\vec{r}(t))\cdot\vec{r}'(t) \right) dt$$
Group Structure on a Circle
Try it yourself: https://www.desmos.com/calculator/fng2pqxd5u

A group is a special kind of set. More specifically, it is a set equipped with an operation (usually called “multiplication”) that maps any two elements to another element in the set in such a way that it satisfies certain axioms. You can read more about this here, but fair warning: it’s not very beginner friendly. In my extremely limited experience, group theory tends to use lots of abstract symbols to represent simple concepts.
The graph defines the elements of the set to be all points on the circle centered at the origin with radius $r$. The operation is a little more complicated. To multiply two points, say $A$ and $B$, begin by drawing the line passing through both points. Then draw the line passing through $(r,0)$ that is parallel to the line passing through $A$ and $B$. The point $A*B$ where this line intersects the circle is the result of the group operation on $A$ and $B$.
It can be shown that when $r=1$, this group is isomorphic to $\mathbb{T}$, the circle group. $\mathbb{T}$ is the group of complex numbers on the unit circle under the operation of complex multiplication. In other words, it represents all planar rotations. Notice how the angle of $A$ and the angle of $B$ always total to the angle of $A*B (\text{mod } 2\pi)$.
Relationship between Derivatives and Integrals
Try it yourself: https://www.desmos.com/calculator/n2qk9cperv
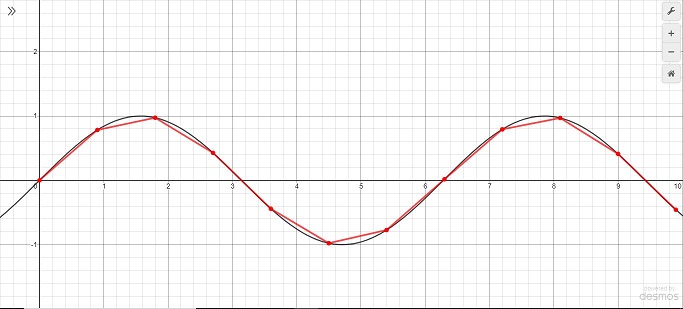
I made a post a while back explaining the relationship between derivatives and integrals. More visual intuition always helps, though, thus the creation of this graph. Each one of those red line segments represents adding a small change in the blue function. As the length of these segments approaches zero, their slopes approach the tangent and they trace out the function. In other words, the integral of the derivative of a function is the function itself. The sum of many tiny changes in some function will yield the function. You can change the $s_{tep}$ slider to change the length of the line segments.
Precursor to the 3D Boat
Try it yourself: https://www.desmos.com/calculator/giwnct5xc3
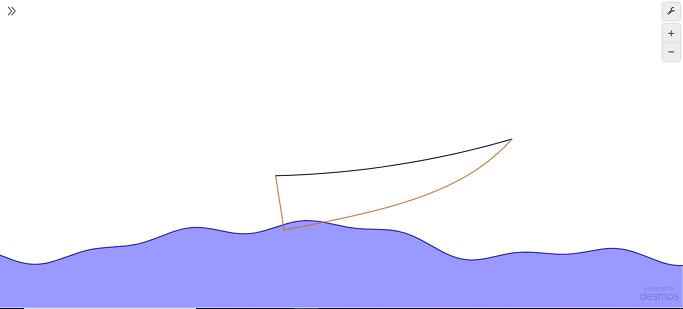
A while back, Desmos had their global art contest. My submission was a 3D boat that moves with the waves in the water. Initially, though, I wasn’t planning on doing it in three dimensions. That seemed like biting off more than I could chew. But, as always, I get very engrossed in such contests, and I ended up doing the 3D boat anyway. This graph is the 2D version of that, a prototype that I ended up abandoning before it was finished. In retrospect, it probably would have been better to go with this graph for my submission. If I had kept it in 2D, I would have had a lot more time to focus on the artistic side of the graph rather than just the mathematics. For example, the boat would have had a mast and a sail and the water would have been way more realistic. There would likely have been background art and other little animations going on in the sky behind the boat.
This graph uses change of basis to tilt the boat as the water goes by (perhaps a bit overkill). Unfortunately, the boat often hovers in midair above the water. This isn’t intentional, but if anybody asks, it’s a boat-plane hybrid…
Linear Transformation
Try it yourself: https://www.desmos.com/calculator/6zgia6y3td
This one’s pretty much exactly as advertised. The graph allows you to put in the entries of a matrix $R$ that defines the linear transformation
$$T(x,y)=R\begin{bmatrix}x \\ y\end{bmatrix}$$
The Desmos graphing calculator doesn’t support matrices, so each row of $R$ is given by a point. The graph shows how evenly-spaced, orthogonally-intersecting gridlines are transformed under $T$.
Reflection
Try it yourself: https://www.desmos.com/calculator/4bvhfpizxg
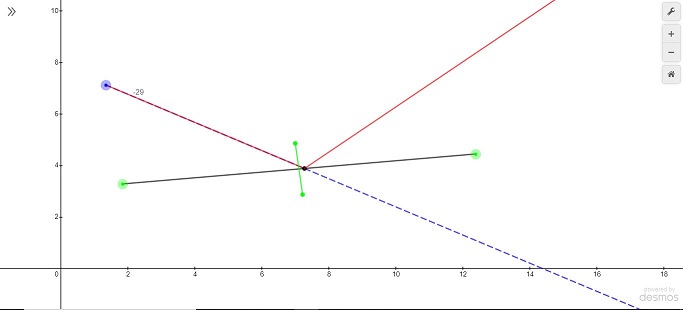
As someone interested in 3D graphics, I naturally have my share of work on light transport. I made this graph while working on a 2D raycaster. Basically, the red line represents a ray of light being emitted from the blue point. The black segment between the two green points represents as a mirror. The goal of this graph is to determine what direction the light is headed after it bounces off the mirror. Many people will be familiar with the equation $\theta_0=\theta_1$ (angle of incidence equals angle of reflection), but it’s slightly more complex than that to implement reflection generally. The raycaster that this graph was built for will likely be released some time under Apps and Games.
Vector Fields
Try it yourself: https://www.desmos.com/calculator/gvnc3bxvq6
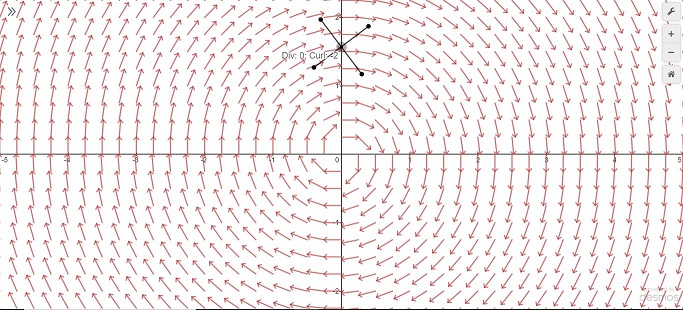
This is the product of haphazard, spaced-out work over a few years. Desmos doesn’t support nested lists, so making a grid of points in one line requires a bit of thought. That was the hardest part of making this graph. If you’re interested in how that part of it is done, check out this graph – but it’s not important to understanding the vector field. Basically, I have a function that can generate a grid of points in a one dimensional array with any width, height, and space between points in each direction.
A vector field is a function that maps every point in space to a vector. In this case, a two dimensional vector field, every point in the plane is mapped to another point in the plane. The little black cross on the graph is the “propeller”. The propeller spins according to the curl at the point where it’s located. Yes, curl is only typically defined in 3 dimensions or higher, but there is a definition for 2 dimensions. For the vector field $\vec{F}(x,y)=\left( \vec{P}(x,y),\vec{Q}(x,y) \right)$:
$$\text{curl}(\vec{F}) = \frac{\partial \vec{Q}}{\partial x} – \frac{\partial \vec{P}}{\partial y}$$
If you look in the graph, these are implemented as approximations because Desmos doesn’t support partial derivatives to my knowledge. The propeller also displays the divergence at its location, which is given by
$$\text{div}(\vec{F}) = \frac{\partial \vec{P}}{\partial x}+\frac{\partial \vec{Q}}{\partial y}$$
General 3D Surface Clipping
Try it yourself: https://www.desmos.com/calculator/pwtkgnwm0q

You may ask: why? And to that, I have to answer. There’s really no reason to have 3D surfaces and clipping in a 2D graphing calculator. Yet, here it is. This uses the algorithm from MathGraph3D to remove the part of the surface on one side of a clipping plane. The plane is defined by the normal vector $\vec{n}=(a,b,c)$ and the point $\vec{p}=(x_0,y_0,z_0)$. If $\vec{n}\cdot{A} – \vec{n}\cdot\vec{p} > 0$ for some point $A$, it means $A$ is on the side of the plane towards which the normal vector points. In this case, $A$ is clipped from the surface and not drawn.
Thanks for reading! Kindly share this post if you enjoyed it.
P.S. just an update on the MathGraph3D creation series.. the next part (surface algorithms) is almost finished, so it should be coming soon. It’s turned into somewhat of a monster, so it might be two separate posts.