In a Desmos Global Math Art Contest-induced fit of madness, I almost forgot to do the annual Desmos graph showcase. But it’s not 2023 yet (hours away!) so nobody can say I didn’t do it. From harmonographs and obscure coordinate projections to artistic animations, this has probably been my most active year with Desmos, which is really saying something, since it has been my primary hobby for quite some time now. As such, attempting to comb through and select only a few graphs that represent the year is an exercise in futility. Nevertheless, here are eight of my favorites, in chronological order from oldest to newest. I’ll try to avoid graphs that I posted on YouTube.
Domain Coloring on the Riemann Sphere
domain coloring on riemann sphere
The Riemann Sphere is a model of the complex plane that uses inverse stereographic projection to fit the entire infinite plane onto a surface with finite surface area. Domain coloring is a method for visualizing complex functions. Complex functions with one input and one output are 4-dimensional, so they’re non-trivial to visualize. Domain coloring works by assigning a color to each number in the complex plane, and moving each input to its output. These colors are determined by the modulus (magnitude) and argument (angle) of the number when in polar form. The resulting diagram, when projected to the sphere, allows us to see the effect of the function over the entire input space!
This graph was inspired by the (extensive) work on domain coloring by a member of the Desmos discord server (who I’ll name here, pending permission).
Domain coloring on the Riemann sphere: https://www.desmos.com/calculator/vl8car9loc
Mobius Transformation on the Riemann sphere, with occlusion: https://www.desmos.com/calculator/vta0ujrell
Mandelbrot set domain coloring on the Riemann sphere: https://www.desmos.com/calculator/edbfaalejr
Fractal Grass
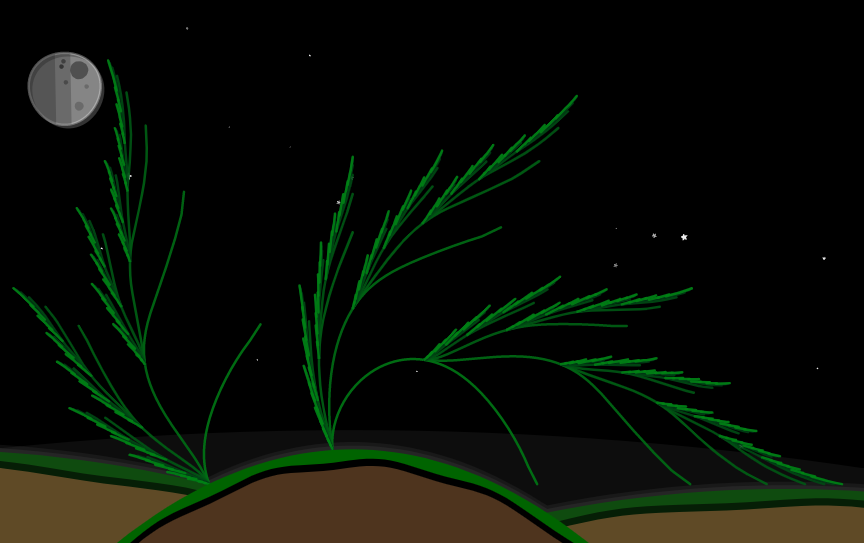
Although it may appear unassuming, this is one of my favorite graphs of all time. As a matter of fact, it’s my desktop background. Those who have followed the posts on this site know that I have a history of recreating nature stuff in Desmos. All the offshoots (branches? petals?), as well as the base of the grass, are generated by a single function with two parameters:
$$f\left(n,x\right)=c\left(x\right)+\sum_{k=2}^{n}\frac{1}{2^{k}}c\left(2^{k-1}x\right)^{2}$$
where
$$c\left(x\right)=\frac{4}{\tau}\left(\tau-\operatorname{mod}\left(x,\tau\right)\right)+\exp\left(-\left(\operatorname{mod}\left(\frac{\left(x-t_{1}\right)}{2},\frac{\tau}{2}\right)-\frac{\tau}{4}\right)^{2}\right)$$
$c(x)$ can be any periodic or quasi-periodic function, really, but this definition in particular provides a very grassy look. For instance, with
$$c\left(x\right)=\operatorname{mod}\left(x,1\right)$$
$f(4,x)$ gives
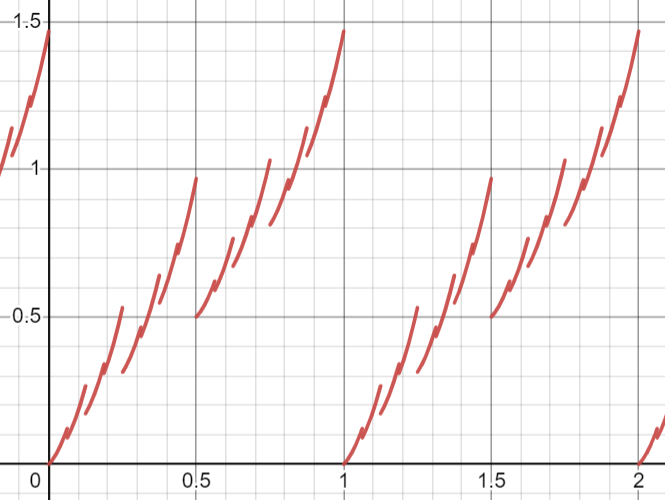
$f$ basically adds together a bunch of instances of $c(x)$ together at increasingly higher frequencies and decreasing amplitudes to create a “fractal jaggedness” effect. The higher $n$ is, the more finer detail (small amplitude, high frequency) is added. Drawing curves with $n$ ranging from $1$ up to some value results in a pattern that resembles grass.
Fractal grass link: https://www.desmos.com/calculator/x64fwdml0p
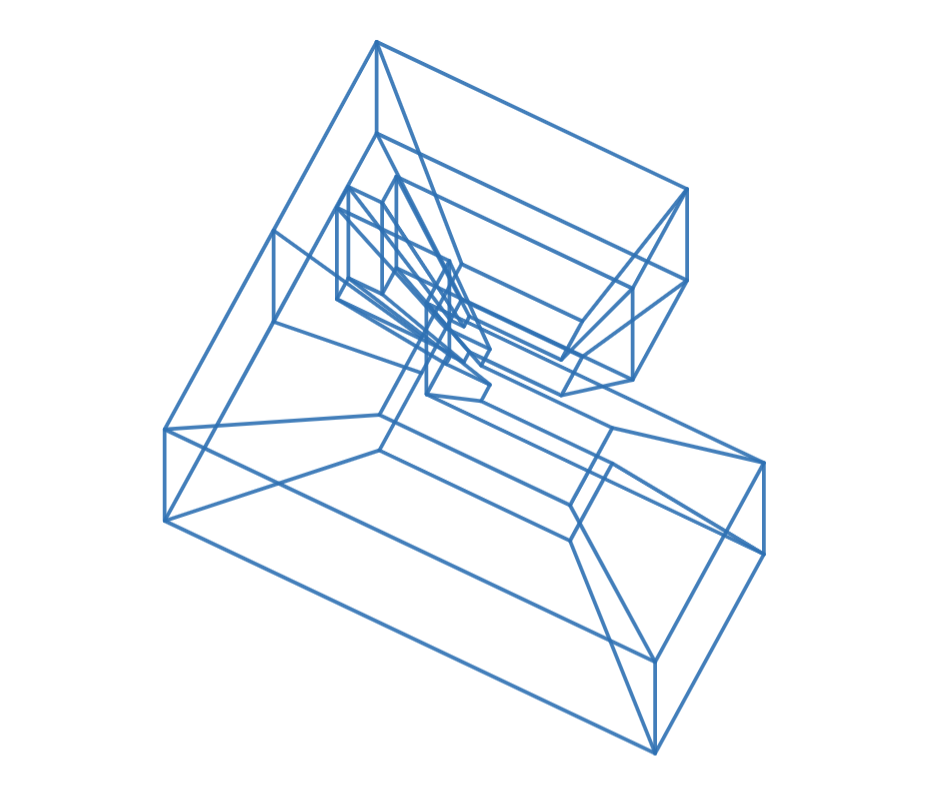
4D Bernard Prism
For those active in the Desmos community online, Bernard is a familiar name. If you don’t know about Bernard (I pity you), he is the artifact caused by Desmos’s quadtree descent algorithm for drawing implicit equations. If you want to know more details about Bernard and why he exists, join the discord server; that’s where all the experts on this subject are. Many people in the discord, on the Desmos subreddit, and certainly elsewhere have tried their hand at an artistic rendition of Bernard. He’s the unofficial mascot of Desmos at this point. I have made countless Bernard-related graphs, one of which is on YouTube, and I even have a solid aluminum laser cutout of Bernard, and a crocheted/stuffed version made by a friend.
This is the only 4D manifestation of Bernard to my knowledge. I formed it by extruding the traditional Bernard prism along each of its faces. This is analogous to the construction of a tesseract, but with Bernard as the base shape instead of a square.
4D Bernard Prism: https://www.desmos.com/calculator/guhpr2t95x
Hanging Rope Curve
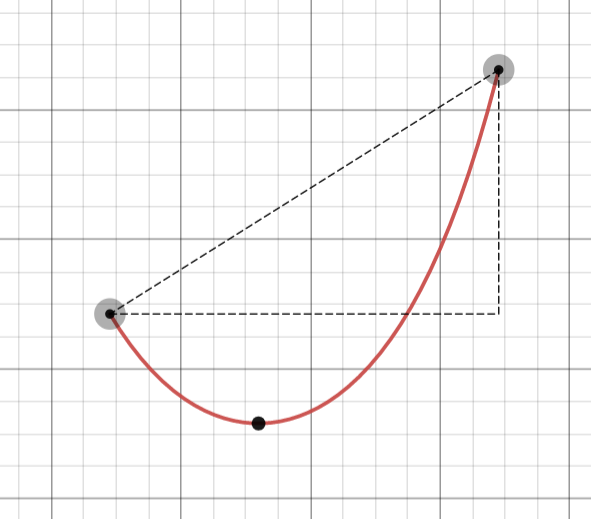
It’s relatively well-known that the shape of a rope hanging between two points, for instance attached to two fenceposts, is not a parabola, even though it kinda looks like that. Instead, it’s a catenary curve. However, nobody ever says WHICH catenary, or how to find a formula for the curve describing a rope of a given length hanging between two points. Thus the creation of this graph. As it turns out, the curve is a scaled and shifted hyperbolic cosine, and the scaling and shifting factors are highly nontrivial to compute. They are dependent on the solution to the transcedental equation
$$\frac{\sinh\left(x\right)}{x}=\frac{\sqrt{L^{2}-\left(y_{2}-y_{1}\right)^{2}}}{\left(x_{2}-x_{1}\right)^{2}}$$
for the rope of length $L$ hanging between $(x_1,y_1)$ and $(x_2,y_2)$. There’s no clean way to solve this, so the graph uses a regression to approximate a solution. The solution to this can be written explicitly with an integral in terms of the Heaviside step function, but there’s no point in that. The integral would not be computable in terms of standard functions, and Desmos evaluates integral expressions numerically anyway. Long story short, there’s no nice answer to this problem (which explains why it isn’t written or documented anywhere!) but at least this graph gives a way of approximating it.
Catenary Rope graph: https://www.desmos.com/calculator/w8yzurtdhe
Stellated Icosahedron
A polyhedron can be represented as a planar graph (fittingly, a polyhedral graph). By triangulating the set of original vertices together with the vertices of the dual graph, we can get a mesh representing a new shape. This is equivalent to adding a new vertex orthogonally a certain distance from the center of each face and connected it to that face’s vertices. This isn’t necessarily a proper stellation, but it’s a similar notion. By iterating this process, we end up with shapes that are, in my opinion, quite interesting.
3 times stellated icosahedron: https://www.desmos.com/calculator/jm8y3zcj4j
Twice stellated icosahedron: https://www.desmos.com/calculator/vdoos6cveb
Dual of Fibonnaci sphere: https://www.desmos.com/calculator/r20npzyfya
Dual of Icosphere: https://www.desmos.com/calculator/fd4kzmty3x
Isometric Basketball Animation
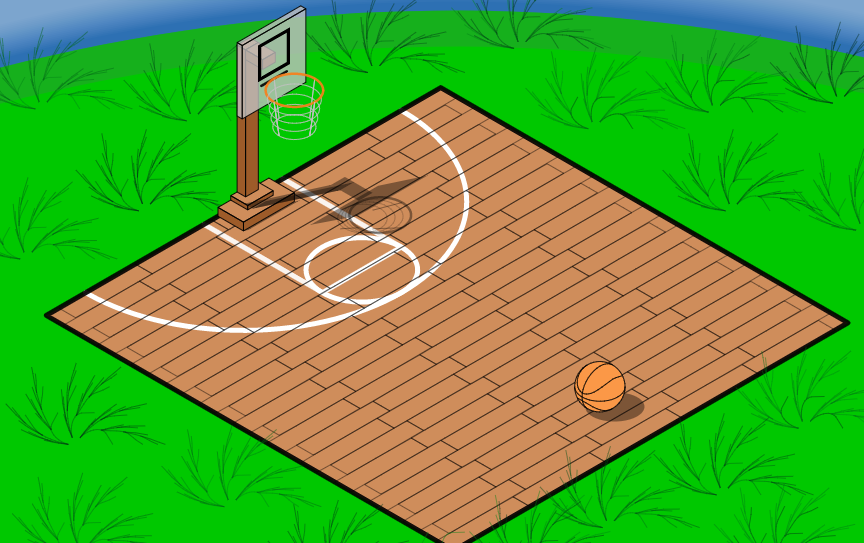
As mentioned, some of these graphs are purely artistic and don’t involve much interesting math. This one uses isometric projection and casted shadows. The shadows are created with a simple ray-plane intersection calculation, from the light source to the ground. You might notice that I put the fractal grass from earlier all around the court even though it’s extremely out of place. It’s because fractal grass deserves to be there, and you can’t do anything about it.
This arguably looks better than both of my art contest submissions from previous years, but that’s going to change this year. For once, I didn’t keep scrapping what I had and starting over, so I’m going to submit a pretty polished and sophisticated graph.
Isometric basketball: https://www.desmos.com/calculator/ukghyi8cdh
Sierpinksi Tetrahedron
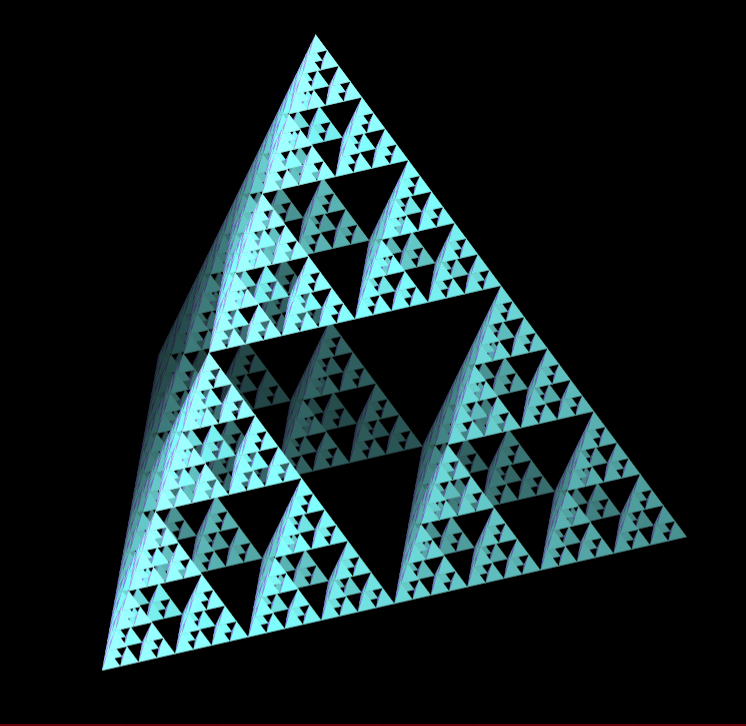
Everybody knows about the Sierpinski triangle, but what about the Sierpinski tetrahedron?? It’s the same idea – start with a tetrahedron, shrink it down to half its height, make 4 copies of the result, and stack them into a pyramid. Repeat this process infinitely, and you’re left with the 3D analog of the Sierpinski triangle. While the Sierpinski triangle has Hausdorff dimension of $log_{2}(3)$, the tetrahedron has Hausdorff dimension $2$. So in a certain sense, it’s slightly spikier than its 2D counterpart, even though both have infinite spikiness. Both shapes have infinite zooming self-similarity.
Sierpinski tetrahedron: https://www.desmos.com/calculator/02v94uiw2g
Candle

Candle in desmos
This is another mostly artistic graph, but this one uses one of my favorite space transformations (I strongly encourage testing the different definitions of $S(x)$ here). People who know me in real life are aware of my crippling obsession with candles, and somehow I managed to carry this over to my other, separate obsession with an online graphing calculator. The space transformation, as applied here, bulges a parametric curve out from a given point in order to recreate the distinct shape of dripping wax. By putting two of these curves next to each other, it can even recreate the signature effect that happens when two wax drops roll down a candle right next to each other.
Candle graph: https://www.desmos.com/calculator/ty3sge2fjw
As always, thanks for reading! Hope you enjoyed.
Cover art: https://www.desmos.com/calculator/jrazw6y8zq