This is mostly a gallery post, showing the contour plots and 3D surfaces of several functions. All of these images were made with MathGraph3D.

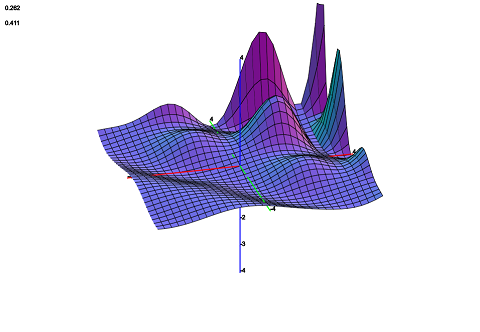
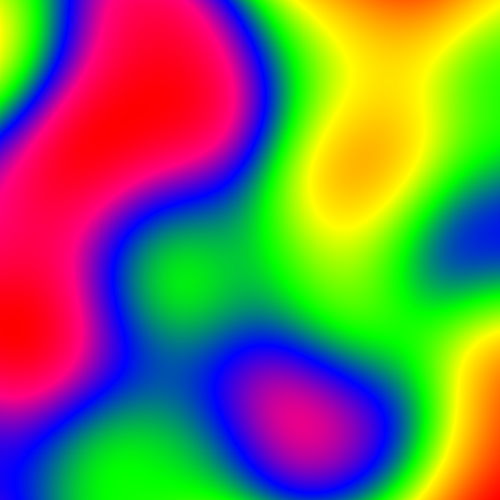
f(x,y) = (sin(x) ^ 2) * (sin(y) ^ 2) * exp((x + y) / 2) / 3 + sin(x + y) / 4 on the region [-4,4] x [-4,4].
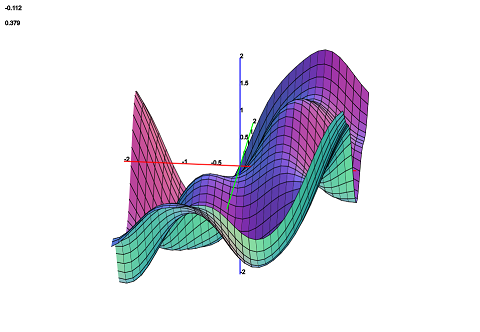
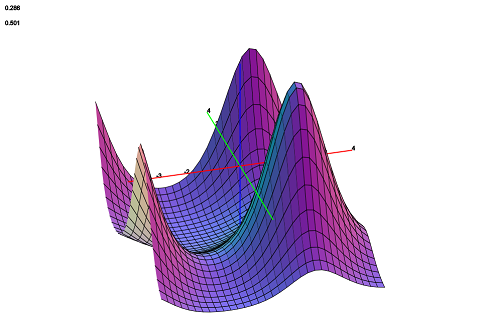
f(x,y) = sin(x + cos(2y)) – cos(y + sin(2x)) on the region [-2,2] x [-2,2].

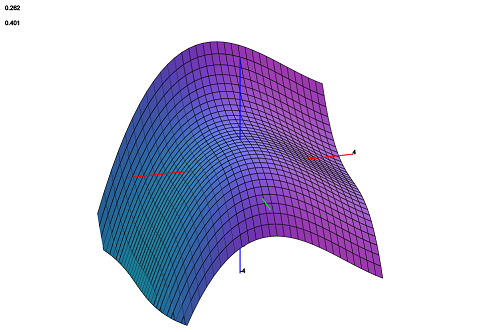
f(x,y) = 1 + (x^3 + y^3) / 32 – 0.25x^2 on the region [-4,4] x [-4,4].

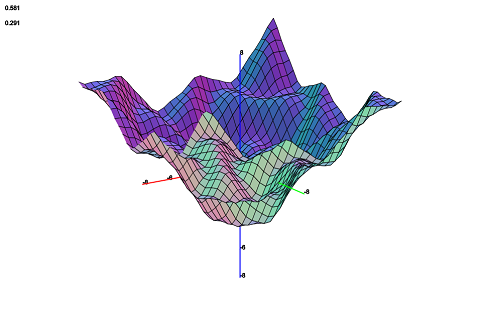
f(x,y) = sin(x + cos(y))sin(y + cos(x)) + (x^2 + y^2) / sqrt(x^2 + y^2) – 5 on the region [-8,8] x [-8,8].

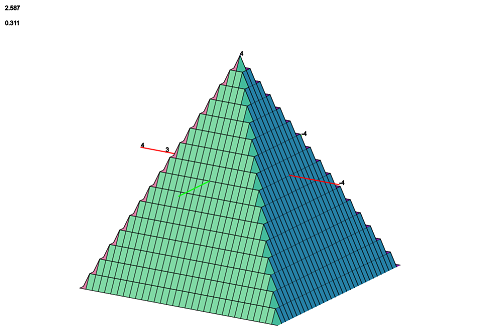
f(x,y) = 4 – abs(x + y) – abs(y – x) on the region [-4,4] x [-4,4].

f(x,y) = exp(sin(x) – 2sin(y / 2)cos(y / 2)) – 3 on the region [-4,4] x [-4, 4].