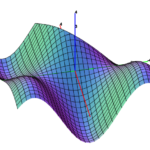
Just like last time, I'm going to share a few of my favorite recent graphs on Desmos. This is probably going to become a yearly thing - despite that the previous part was my first post ever, it remains the most popular. That's probably due to the fact that r/visualizedmath on Reddit won't let me post anymore to share my work. Anyway, on with the graphs...
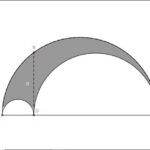
November 2019 MCC Puzzler
Try it yourself: https://www.desmos.com/calculator/qsy5qk4sjv
Last year, I took a couple math classes...
Read More
Math
Project Euler – Number Spirals
Another Project Euler problem has sparked my attention. This one isn't particularly difficult (much less than the last one I posted about - despite being in the same category of difficulty), but it's an interesting problem with a nice solution. Most people probably don't approach this in the way I did, but for once I think my solution is cleaner than the others that are posted on the forum. The problem statement can be found here: Problem 28 Statement.
Like last time, I'm going to proceed un...
Read More
Project Euler – Lattice Paths
Recently, I've been doing a bunch of Project Euler problems. If you're unfamiliar with Project Euler, it's a collection of challenging puzzles that require math and programming to solve. The puzzles are grouped by difficulty level. However, I've found that the difficulty can vary wildly within the same group. One challenge that stood out as much harder than the rest is Problem 15. The problem statement can be found here: Problem 15 Statement.
Now, I'm going to continue under the assumption ...
Read More
Contour plots and their surface counterparts
This is mostly a gallery post, showing the contour plots and 3D surfaces of several functions. All of these images were made with MathGraph3D.
f(x,y) = (sin(x) ^ 2) * (sin(y) ^ 2) * exp((x + y) / 2) / 3 + sin(x + y) / 4 on the region [-4,4] x [-4,4].
f(x,y) = sin(x + cos(2y)) - cos(y + sin(2x)) on the region [-2,2] x [-2,2].
f(x,y) = 1 + (x^3 + y^3) / 32 - 0.25x^2 on the region [-4,4] x [-4,4].
f(x,y) = sin(x + cos(y))sin(y + c...
Read More
Creation of MathGraph3D (Part 1 – Foundation)
This series focuses on the creation of the original version of my 3D plotting software MathGraph3D. This first part is concerned with the overall structural components of the software.
Before getting into any actual algorithms or math, it’s necessary to set up an outline for how the code will be structured. I decided to create a manager class called “Plot” that would handle everything to do with 3D space and all objects in the calculator. There are five main operations that the Plot must be ...
Read More
Building a 3D Boat in Desmos
The graphing calculator Desmos recently held a competition called the Global Math Art Contest. People aged 13-18 submitted artwork they created with the graphing calculator using combinations of math curves. The judging is based on creativity, originality, visual appeal, and the math used to create the art. As a person with little artistic talent, I had to rely on the use of math category to get my edge. So I decided to create a rotatable 3D boat that moves and tilts according to the waves in t...
Read More
Common misconceptions about the differentiation operator
(Note: math may not render properly in Microsoft Edge. Any other browser should work, though. I'm trying to figure out the source of this issue.) This is the differentiation operator in single variable calculus:
$$\frac{d}{dx}$$
Since several procedures in calculus happen to involve manipulating the "numerator" and "denominator" of the differentiation operator, people have gained the incorrect idea that it IS in fact a ratio of two "infinitely small" quantities. This is absolutely not tru...
Read More
Fundamental Theorem of Calculus Explained
Relation between derivatives and integrals
/*!
*
* Twitter Bootstrap
*
*/
/*!
* Bootstrap v3.3.7 (http://getbootstrap.com)
* Copyright 2011-2016 Twitter, Inc.
* Licensed under MIT (https://github.com/twbs/bootstrap/blob/master/LICENSE)
*/
/*! normalize.css v3.0.3 | MIT License | github.com/necolas/normalize.css */
html {
font-family: sans-serif;
-ms-text-size-adjust: 100%;
-webkit-text-size-adjust: 100%;
}
body {
margin: 0;
}
article,
aside,
details,
figcaption,
figur...
Read More
Fluid flow in vector fields
I made a python program that simulates fluid particles flowing through a vector field. Here I'll put some things I discovered, some example gifs, and the complete code file.
Some patterns
A vector field is created by inputting points into a vector valued function and placing the tail of each output vector at its corresponding input. As I explored the particle flow of vector fields of different functions with my program, a few patterns started to emerge. The main ones are:
Attraction p...
Read More
Collection of Desmos Graphs
Recently I went through my old Desmos (https://www.desmos.com/) graphs and I'd like to share 5 of my favorites here. There are some additional interesting graphs at the bottom that are cool as well. You can click on the links after each header to edit and interact with the graphs in the browser.
Complex Plane Rotation
Try it yourself: https://www.desmos.com/calculator/sprwnkggss
The goal of this graph is to take a function $f(x)$ and rotate it around the origin by an arbitrary radian a...
Read More