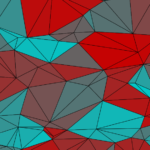
Everyone has seen a topographical map at some point during their life. In addition to the information that regular maps have, topographical maps typically show land features and elevation. How are these maps generated? Given that it's not possible to sample the elevation at every single point in the area of interest, we must use some sort of interpolation. To tackle this mathematically, we should make a few simplifications.
As you might agree, the Earth is round. However, if we consider the ...
Read More
mathgraph3d
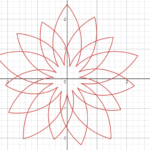
Parametric Flowers
"Mathematical beauty" usually refers to the elegance of a proof, that is, how cleanly some mathematical result is proven with a convincing argument. That certainly sounds appealing to those who are already immersed in math, but it's not clear how such a result is "beautiful" in the general sense of the word. The goal of this post is to give an example of how math can be beautiful in a more accessible and universal way: the creation of art. We'll create flower designs with a large degree of arti...
Read More
Differential Equation Model for Language Learning
Due to the COVID pandemic, the Susceptible-Infectious-Removed (SIR) model for disease spread has grown wildly in popularity. SIR is a system of differential equations that models the evolution of a disease over time. Knowledge of the SIR model is not necessary to understand this post, but there are many great videos about it online if you want to learn more. My favorites are: Simulating an epidemic by Grant Sanderson, Oxford Mathematician explains SIR Disease Model for COVID-19 (Coronavirus) by...
Read More
Creation of MathGraph3D (Part 3 – Coloring and Lighting)
This series focuses on the creation of the original version of my 3D plotting software MathGraph3D. The first part was about the overall structure of the software. The second part was concerned with all algorithms for smoothing and optimizing surfaces. This third part discusses coloring, lighting, and styling the objects that MathGraph3D plots. I'll try to keep this part shorter than the other ones... posts in this series have a tendency to spiral out of control.
In MathGraph3D, every plotta...
Read More
Creation of MathGraph3D (Part 2 – Surface Algorithms)
Finally, after a few months of promising this post, here it is. This series focuses on the creation of the original version of my 3D plotting software MathGraph3D. The first part was about the overall structure of the software. This second part is concerned with all algorithms for smoothing and optimizing surfaces.
The basic idea of writing a program to plot 3D surfaces isn't too difficult once you get all the 3D space handling techniques covered. A naive script would map a mesh of input poi...
Read More
Contour plots and their surface counterparts
This is mostly a gallery post, showing the contour plots and 3D surfaces of several functions. All of these images were made with MathGraph3D.
f(x,y) = (sin(x) ^ 2) * (sin(y) ^ 2) * exp((x + y) / 2) / 3 + sin(x + y) / 4 on the region [-4,4] x [-4,4].
f(x,y) = sin(x + cos(2y)) - cos(y + sin(2x)) on the region [-2,2] x [-2,2].
f(x,y) = 1 + (x^3 + y^3) / 32 - 0.25x^2 on the region [-4,4] x [-4,4].
f(x,y) = sin(x + cos(y))sin(y + c...
Read More
Creation of MathGraph3D (Part 1 – Foundation)
This series focuses on the creation of the original version of my 3D plotting software MathGraph3D. This first part is concerned with the overall structural components of the software.
Before getting into any actual algorithms or math, it’s necessary to set up an outline for how the code will be structured. I decided to create a manager class called “Plot” that would handle everything to do with 3D space and all objects in the calculator. There are five main operations that the Plot must be ...
Read More